1. The Anatomy of Measurement: From Eddy Currents to Hall Effect
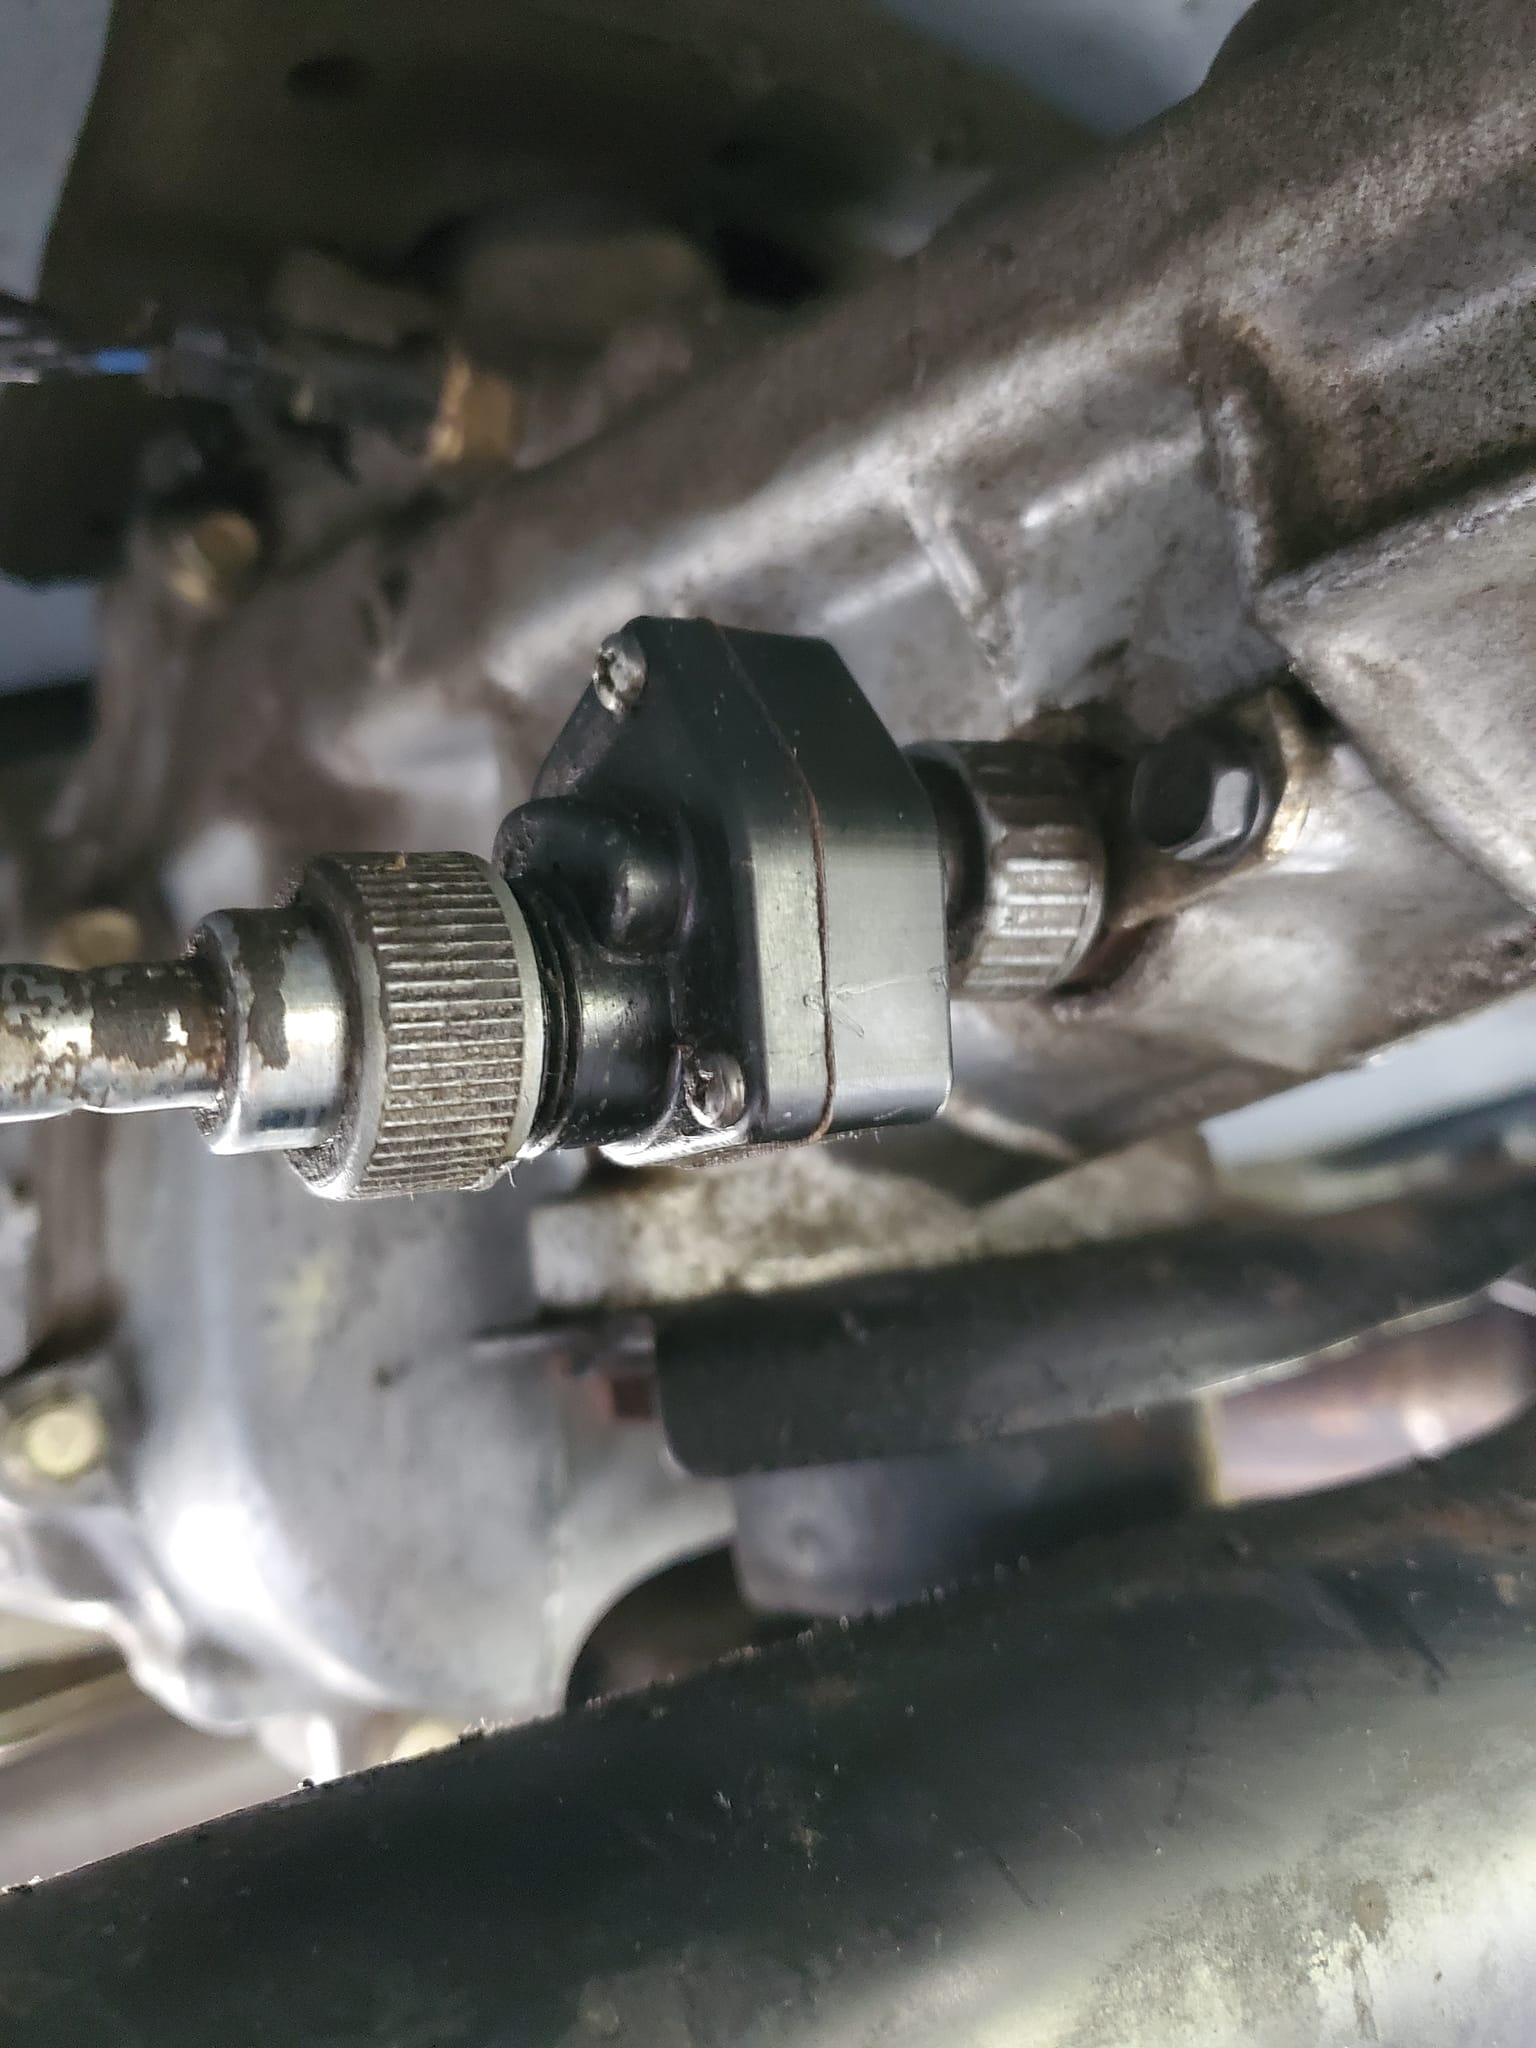
To understand modern velocity tracking, one must analyze the transition from mechanical to digital sensing. Original mechanical speedometers utilized a rotating magnet to induce eddy currents in an aluminum cup, pulling a needle against a hairspring.Today, the industry has standardized on the Hall Effect sensor. These digital transducers detect magnetic flux changes from a rotating tone ring on the transmission or wheel hub, sending square-wave pulses to the ECU. This shift from physical torque to Pulse-Width Modulation (PWM) data packets is the foundation of modern vehicle automation, where speed is treated as a high-priority telemetry stream.
2. Velocity as a Diagnostic Tool
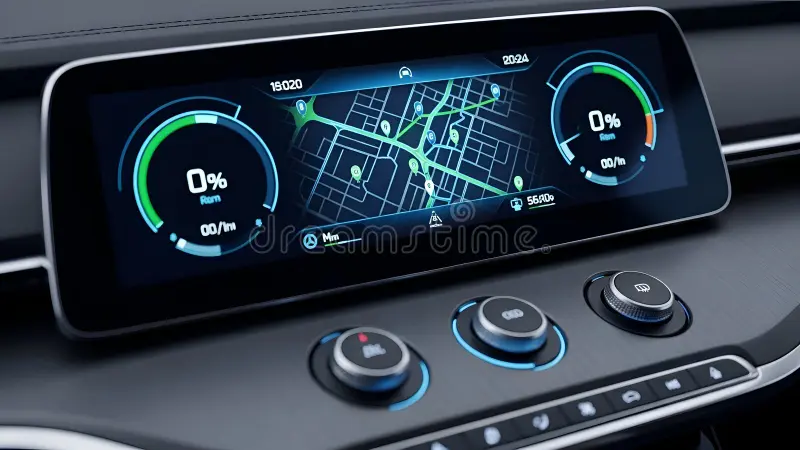
In the context of vehicle diagnostics, a speedometer does more than display MPH; it monitors the integrity of the powertrain. * Throughput vs. Latency: The 'speedometer' of a car's internal CAN-bus must reconcile raw sensor pulses (throughput) against the temporal delay of signal processing (latency). If the data refresh rate drops below 60Hz, the resulting UI jitter can compromise driver responsiveness. * Bottleneck Detection: Just as a vibrating needle can indicate a slipping transmission cable, 'digital jitter' in a virtual cluster identifies bottlenecks in the car's central gateway or ECU processing cycles.3. The Precision Paradox: The 'Golden Velocity'
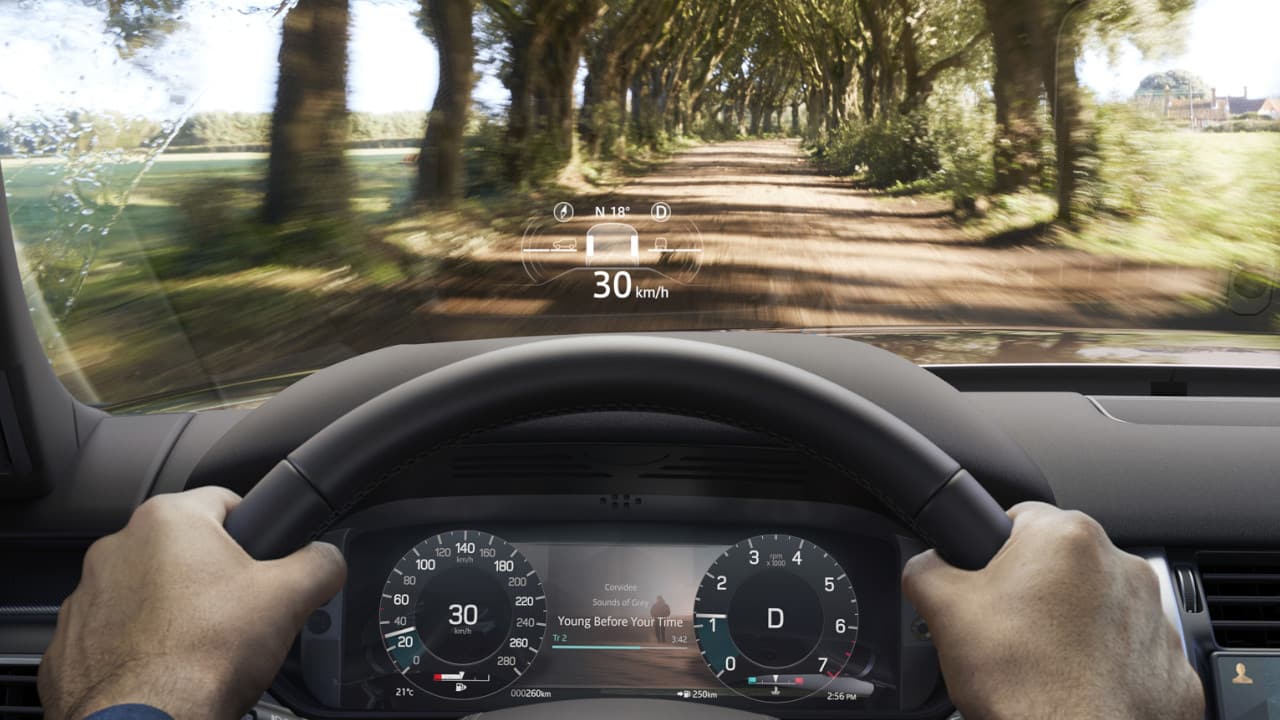
A speedometer is ultimately a tool of control. In the development of Advanced Driver Assistance Systems (ADAS), engineers seek the 'Golden Velocity'—the maximum speed at which the Sensor Fusion (combining GPS, LiDAR, and wheel pulses) remains 100% deterministic. Pushing a system beyond this threshold introduces data noise, where the physical reality of the road outpaces the software's ability to render it.4. Implementing a Telemetry 'Speedometer' for System Audits
To monitor the efficiency of any high-speed data system, follow this engineering workflow: 1. Define the Pulse: Establish a unit of work (e.g., one rotation of a 48-tooth tone ring). 2. Temporal Windowing: Calculate velocity using a sliding window to filter out transient signal noise. 3. Visualization: Utilize a high-refresh UI (such as an OLED cluster or a real-time HUD) to render the 'needle' movement, allowing for intuitive identification of system fluctuations.