In reality, this is a fundamental misunderstanding of technical instrumentation. To understand why this distinction matters—especially in the context of automation and high-frequency systems—we need to look at how data is captured, processed, and visualized.
1. The Myth: Instantaneous vs. Average
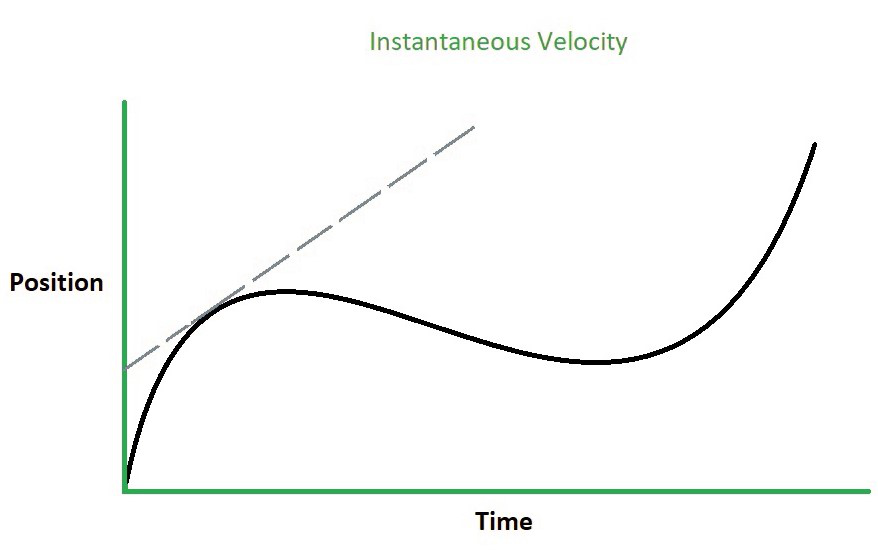
To be clear: a speedometer measures instantaneous speed, not average speed.
* Average Speed: A retrospective metric. It is the total distance traveled divided by the total time elapsed. You can only know your average speed once a journey (or a segment of it) is complete. * Instantaneous Speed: The 'right now' measurement. In physics terms, it is the limit of the average speed as the time interval approaches zero.
In software automation, this distinction is mission-critical. If you are running a high-frequency script, you don't just care about hourly throughput (the average); you care about the latency and burst-speed of each individual action (the instantaneous). A developer needs to know if a system is currently throttling, not just how it performed over the last hour.
2. The Telemetry Chain: How Your Dashboard Works
Modern vehicles are mobile sensor networks. To provide that 'instant' reading, the car uses a sophisticated telemetry chain:
* The Source (The Pulse): A Hall Effect sensor on the transmission or wheel hub generates an electrical pulse every time a magnet passes it. * The Processor (The ECU): The car's brain counts these pulses over a tiny fraction of a second. Using the known circumference of your tires, it calculates the exact distance traveled in that millisecond. * The Interface (The UI): Whether it's a physical needle or a digital screen, the display visualizes these high-frequency snapshots. Because these updates happen many times per second, the movement feels continuous to the human eye.
3. The Automation Connection: Precision over History
For users of automation tools and performance monitoring software, the 'speedometer vs. average' analogy is highly relevant. Looking only at 'Average Uptime' can hide catastrophic 3-second lag spikes that cause a hundred failed requests.
* Identify Pulse Points: Track the smallest unit of work (e.g., a single API call or page load). * Real-Time Monitoring: Use sub-second telemetry. If your dashboard refreshes every 5 minutes, you aren’t seeing speed; you’re seeing history. * Visualize the Spikes: Use histograms or real-time logs rather than simple line charts. This reveals the 'outliers' that an average would typically hide.
4. GPS vs. Speedometers
Many notice a delta between their car's dashboard and GPS apps like Waze. This is because GPS calculates speed differently—by measuring the change in your coordinates over time (Position B minus Position A divided by Time). In a sense, a GPS is much closer to a high-frequency 'average speed' calculation, whereas the mechanical speedometer is a direct, instantaneous measurement of rotation.
Final Thought

Precision is your greatest asset. Whether you are behind the wheel of a high-performance vehicle or managing a sophisticated automation suite, don't settle for averages when you need the truth of the moment. By focusing on instantaneous metrics, you can troubleshoot faster and optimize your systems with far greater depth.